PowerCoach
Developer Version 00.08.11
This document and the treated topics refer to build 20011020 of PowerCoach Developer Version 00.08.11. The included upgrade information is intended for users of release versions 00.08.07, 00.08.08, 00.08.09 and 00.08.10.
Have a look
at the Definitions for Keyboard and Mouse Commands
to become familiar with PowerCoach symbols
and syntax
used in this documentation.
Statistics, Performance and Regulation
Album Picture Projects in "Explorer" Job
Export and Import of PCO Files
Export and Import of ASCII Files
Import of SRM Training System Files
Import of new Data Series File Types
Keyboard Commands acting on Graph Windows
Data Display Mode on Graph Windows
Graphic Exploration and Analysis of Periodization
Commands of "Partial Range" Pop Up Tools
Keyboard Command Focus on Data Tables
Keyboard Commands acting on Jobs and Windows
Statistics, Performance
and Regulation
• Some functions, tools and objects of "Data Series" Jobs have new names in order to reflect basic concepts of PowerCoach:
- Performance renames former analysis 1.
- Regulation renames former analysis 2.
Job Window pages of "Data Series" Jobs and CALC modes of the CALC tool are now renamed accordingly, for example:
- "No calculations"
- "Statistics"
- "Statistics . Performance"
- "Statistics . Performance
. Regulation"
• Statistics functions and tools answer questions like
- "How much of what?"
• Performance functions and tools answer questions like
- "What for how long?"
• Regulation functions and tools answer questions like
- "Which performance results in which state of physiological regulation?"
- "Which state of physiological
regulation results in which performance?"
Album Picture Projects
in "Explorer" Job
"Explorer" Job Window page 1 (named "PowerCoach") may now be used to display Album Picture Projects:
• Click the Picture area to get the pop up tool used to load your saved Picture Projects and to control Picture display.
• Use this pop up tool to choose timing options for automatic display.
• Type [RET] to start and stop automatic display.
• Use Arrow keys (together with Multipliers) to control manually Picture display if automatic display is stopped.
• Use standard marking commands
of the pop up tool and use the marking keys [ENT] or [F12]
to mark or unmark Pictures. If [LOC] is activated, only the marked
Pictures of a Project will be displayed.
Export and Import of PCO
Files
In "Person X" Jobs, you may now export one selected data series or a variable number of marked data series to one PCO file:
• This feature permits easy communication of complex data (for example all training rides and races of a rider of last week) from PowerCoach to PowerCoach with simple export and import commands.
• Use the "Export data series..."
or "Export marked data series..." command of the "Person X" Job menu to
create this type of PCO file.
REMEMBER
(regarding PCO files in general):
• In
"Person X" Jobs, you may export one selected data series or a variable
number of marked data series (of the person X) to one PCO file.
• In the "Persons" Job, you may export one selected person or a variable number of marked persons to one PCO file.
Use the "Export person..." or "Export marked persons..." command of the "Persons" Job menu to create such files. They contain, besides the other personal objects and data, the complete set of all recorded data series of each person exported.
Use these commands
to create easily complete and compact backup files of all objects and data
belonging to one person or to a group of distinct persons.
• Use the "Import..." command of the "PowerCoach" main menu to import any type of PCO file. You may import on Windows computer platform or Mac OS computer platform any PCO file exported either on Windows computer platform or Mac OS computer platform. Choose and apply standard import rules
- "Existing
objects have priority"
- "Imported
objects have priority"
- "Last
modified objects have priority"
for efficient
update and feedback communication, for examples between athletes, coaches
and consultants.
Export and Import of ASCII
Files
Exported ASCII files of PowerCoach data series contain now the values units of the series. If available, the files include also the body mass and maximum HRA values (with respective units) of the person.
Importing such files again with PowerCoach executes automatically the corresponding unit conversions.
When PowerCoach launches a "Data
Series" Job, the data values of series are converted and displayed in the
data table using the values units saved with "Setting 1" of the "Time Series"
Graph.
REMEMBER: "Setting 1" are default user settings of Graphs. You may replace "Setting 1" of each Graph type with your own settings.
1. Make sure the GRAPH tool is adapted to the respective Graph type.
2. Click the invisible pop up tool located on the "Graphs" area of the GRAPH tool.
3. Select "Setting 1" and hold down simultaneously [CTR] key.
4. Confirm replacement of "Setting 1" with the actual setting of the Graph.
NOTE:
Selecting in pop up tools saved items, holding down simultaneously [CTR]
key, is a standard command in PowerCoach to request "replacement" of the
selected item.
REMEMBER (regarding ASCII files in general):
• To create ASCII files of PowerCoach data series, use the "Export..." command of the "Data Series" Job menu. You may export the whole data series or the marked range of the data series.
• The files are automatically named with ID code, start date and start time, for example
- XXX.20011010.123010.TXT
(WIN)
- XXX.20011010.123010
(MAC)
• On WIN, exported files are automatically saved to the folder location of last file input or file output action.
• On MAC, exported files are automatically saved to the PowerCoach Program folder.
• The structure of ASCII files of PowerCoach data series is straight forward. Data stream values are [TAB] separated.
• You may open ASCII files of PowerCoach data series with text processors (like MICROSOFT Word) and spreadsheet applications (like MICROSOFT Excel).
• You may create and edit (with text processors, spreadsheet applications or proprietary software) such [TAB] separated ASCII files of recorded or simulated data series and import them into PowerCoach.
• Use
the "Import..." command of the "PowerCoach" main menu to import ASCII files
of PowerCoach data series.
Import of SRM Training
System Files
Importing export files of SRM Training System software, PowerCoach now separates recording blocks that are "stuck together". In contrast to SRM Training System software, PowerCoach displays data series correctly on time axis.
Importing SRM Training System files
including SPE series, you must now confirm or set the values unit of SPE
data. At the same time, you may enter the start time of the imported data
series.
Import of new Data Series
File Types
• CATEYE: Import of .csv files saved on MAC with Mac OS version of E-TRAIN software is supported. Former versions of PowerCoach supported only files saved on WIN with Windows version of E-TRAIN software. E-TRAIN .csv files may include SPE, CAD and HRA series.
• POLAR: Import of new .hrm file types saved with POLAR Precision Performance software is supported. PowerCoach integrates all series recorded with POLAR device S710 using POWER OUTPUT SENSOR. These new .hrm files may include SPE, CAD, POW, HRA, ALT, PDX, PWL, PWR and PWB series.
• ERGOMO: Import of ERGOMO power meter system export files is supported. ERGOMO export files may include SPE, CAD, POW, HRA and TEM series.
• WINPULS: Import of WINPULS
export files is supported.
Keyboard Commands acting
on Graph Windows
• New Keyboard Commands acting
on Graph Windows permit fast and intuitive graphic data exploration and
analysis.
REMEMBER:
You may act on a Graph Window using Keyboard Commands when the Graph Window
is on top.
• Use the Keyboard Commands in conjunction with your saved Graph settings and in conjunction with the following commands of the Graph Window context menu:
- "Graph setting: Copy"
- "Graph setting: Apply copy"
- "Graph setting: Save..."
REMEMBER:
To apply a saved Graph setting to a Graph Window, click the invisible pop
up tool located on the "Graphs" area of the adapted GRAPH
tool, and select the named setting.
• Type [w] or [W] until Keyboard Command focus of a Graph Window is set on
- "W1" WINDOW POSITION
- "W2" WINDOW SIZE
Use Arrow keys (together with Multipliers)
to act on "W1" and "W2".
REMEMBER:
The symbol of the current Keyboard Command focus is displayed at the top
left corner of a Graph Window (for example, "W2" shows at the top left
corner while Keyboard Command focus of a Graph Window is set on WINDOW
SIZE).
• Type [j] or [J]
to move the JOB Window (related to a Graph Window) on top.
• Type [d] or [D]
to switch DATA display mode on/off.
• Type [t] or [T]
to switch Graph
TITLE on/off.
• Type [h] or [H]
to switch HORIZONTAL grid lines on/off.
REMEMBER (other Keyboard Commands on Graph Windows):
• Type [q] or [Q] to QUIT and close the Graph Window.
• Type [a] or [A] to set AUTOMATIC Y axis scaling.
• Type [f] or [F] to set FIXED Y axis scaling.
• Type [l] or [L] to switch LABELS of X axis on/off.
• Type [c] or [C] to switch CURSOR on/off.
• Type
[i]
or [I] to switch
INTERACTIVE selection on/off.
REMEMBER
(how to set Keyboard Command focus on various Graph control parameters):
• Type [x] or [X] until Keyboard Command focus is set on
- "X mx" MAXIMUM X
- "X mn" MINIMUM X
- "X"
X
AXIS RANGE
• Type [y] or [Y] until Keyboard Command focus is set on
- "Y mx" MAXIMUM Y
- "Y mn" MINIMUM Y
- "Y"
Y
AXIS RANGE
• On 3D Graph Windows, type [z] or [Z] until Keyboard Command focus is set on
- "Z mx" MAXIMUM Z
- "Z mn" MINIMUM Z
- "Z"
Z
AXIS RANGE
• On 3D Graph Windows, type [p] or [P] to set Keyboard Command focus on
- "P"
PERSPECTIVE
• On 2D Graph Windows, type [s] or [S] to set Keyboard Command focus on
- "S"
SELECTION
REMEMBER:
If a Graph control parameter has the Keyboard Command focus, you may act
on it using Arrow keys and Multipliers.
Data Display Mode on Graph
Windows
• If DATA display mode is
on for a Graph, the symbol of the current Keyboard Command focus at the
top left corner of the Graph Window drops down one line and the value of
the currently selected Graph element is displayed together with the corresponding
values of the series.
• If you type [s] or
[S]
to set Keyboard Command focus on "S" SELECTION, and
if DATA display mode is on, you may explore accurate data values on Graph
Windows using Arrow keys (together with Multipliers).
REMEMBER (regarding Arrow keys and Multipliers in general):
[<-]
moves selection to first element.
[->]
moves selection to last element.
[UP]
moves selection to previous element.
[DO]
moves selection to next element.
[CTR]
multiplies by 10 on WIN.
[CTR]
multiplies by 10 on MAC.
[SHI]
multiplies by 100 on WIN.
[ALT]
multiplies by 100 on MAC.
[CTR] [SHI]
multiplies by 1000 on WIN.
[CTR] [ALT]
multiplies by 1000 on MAC.
• If DATA display mode is on, and if the MOUSE IS NOT rolling over graphed data series objects, the following information is displayed:
. Symbol "S" shows at the top left corner of the Graph Window.
. The table element value of the current SELECTION is displayed together with the corresponding series data values.
. The table element value of
the current selection and the corresponding series data values are displayed
and updated while Graph Windows are at the back.
NOTE: Graph Windows containing many graphed series might not be wide enough to show the data values of all included series. For examples,
. "Time Series" Graphs may include up to 11 series.
. "Calendar: Parameters [rec]" Graphs may include up to 14 series.
To make sure
that the values of a distinct series are displayed, click a graphed data
object of the series you want to appear first in the list of displayed
series data values.
• If DATA display mode is on, and if the MOUSE IS rolling over a graphed data series object, the following information is displayed:
. Symbol "?" shows at the top left corner of the Graph Window.
. The data value of the TOUCHED
OBJECT is displayed together with the corresponding table element value.
Graphic Exploration and
Analysis of Periodization
• "Person X" Jobs offer now a new Graph type. Use the GRAPH tool and click the invisible pop up chooser on the Graph indicator to select the Graph
- "Calendar: Parameters [rec]"
This Graph is interactively related and linked to the table of recorded data series and its powerful search and mark engine (like the "Calendar: Data Series" Graph).
Play with the
"Search and mark data series..." tools and functions to understand
their power. For example, use the special command "Mark..." of the "Calendar:
Parameters [rec]" Graph Window context menu.
REMEMBER:
Click the invisible pop up chooser located on "Search criteria" label area
of the "Search and mark data series..." dialog window to select and apply
various search criteria. Select the symbol of a logical search operator
"OR", "AND" or "NOT" to pursue search strategies in sets of marked series.
• The "Calendar: Parameters [rec]" Graph is a sophisticated exploration and analysis tool regarding the aspects of periodization. It offers special Graph Window context menu commands, to switch between three different context menu types:
- "Standard"
- "Design"
- "Series"
The "Standard" menu contains the set of standard commands, like other Graph Window context menus.
Play with the command sets of the "Design" menu and the "Series" menu to understand the functions of these special menu types, for example:
. Calling the "Design" menu on the distinct chart area of a specific parameter, certain commands will act only on this parameter.
. Calling the "Design" menu
on the common Graph area (for example on title or label area), the command
will act on all parameters.
• The values of individualized parameter types, named "XXX.rec.IN", are normalized relative to the 365 preceding days rolling average per day of the person. Individualized parameters reflect precisely, for each day or (if smoothing functions are applied) for any distinct time period, how much daily load was above or below average of that person.
Switch DATA display mode on to combine graphic exploration with precise parameter analysis.
NOTE:
The potential power of individualized and normalized data exploration and
analysis may be fully used, once a person has recorded a continuous data
base of his activity for at least 1 year.
• DATA display mode is not available on "Calendar: Parameters [rec]" Graphs while chart display type is set to "Area". To have DATA display mode available, set chart display type to "Bars". Use "Design" menu commands
- "Display: Area"
- "Display: Bars"
to set the chart display type of
a "Calendar: Parameters [rec]" Graph.
Choosing Value Units
• In general, you may now
choose dynamically different value units for data at most places where
unit labels are displayed on "Data Series" Job Windows, related CALC tools
or the adapted GRAPH tool. Click invisible pop up choosers overlaying everywhere
the unit label areas.
• Graph Window context menus
include now standard commands, to choose dynamically between different
units of graphed data for X axis and Y axis.
• In "Data Series" Jobs, the "Time Series" Graph offers special Graph Window context menu commands, to switch between three different context menu types:
- "Standard"
- "Design"
- "Series"
. The "Standard" menu contains the set of standard commands, like other Graph Window context menus.
. Using "Design" menu, you may choose dynamically between different units for time axis and for available series, including relative units like "Watt/kg" for POW series and "% mx" for HRA series.
. Using "Series" menu, you
may show or hide selectively available series.
Functions of CALC Tools
• Clicking calculated minimum or maximum series values on CALC tools now moves the related Job Window on top and displays a window page where the clicked value is visible and selected in the data series table:
. The data series table automatically gets the Keyboard Command focus.
. Typing [g] or [G]
at this point opens or moves on top the related "Time Series" Graph Window.
• Clicking calculated average series values on CALC tools now moves the related Job Window on top and displays the "Statistics" window page. The histogram class of the clicked value is visible and selected in the corresponding histogram table:
. The corresponding histogram table automatically gets the Keyboard Command focus.
. Typing [g] or [G]
at this point opens or moves on top the related "2D Histogram" Graph Window.
REMEMBER: You may use histogram data tables or related "2D Histogram" Graphs as dynamic "Calculators". Mark elements of histogram tables, to see at the bottom of the tables the sum of time values corresponding to marked elements.
For example, set the values unit of the HRA histogram table to "bpm" and
- mark elements range 147 to 154
to know instantly
how much time was spent in the heart rate zone from 147 to 154 beats per
minute.
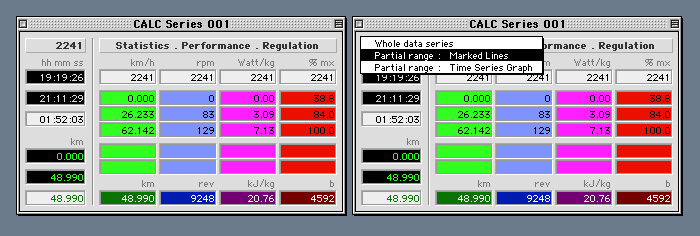
Commands of "Partial Range"
Pop Up Tools
Invisible "Partial Range" pop up tools of "Data Series" Jobs contain new commands:
- "Mark: Copied range"
- "Copy: Marked range"
Once that a partial range is defined in a Job (by the first marked element and the last marked element of the data series table), you can mark easily the same range in other Jobs using these commands.
The copy of a partial range is memorized
and may be applied (to mark the corresponding range in data series tables
of other Jobs) until a new marked range is copied.
REMEMBER: Invisible "Partial Range" pop up tools are located on the label areas
- t.rec
- DIS
- REV
- WPE
- WCA
of data series table headings. Using these tools, you may define, name and save an unlimited number of partial ranges for each parameter type. For example, you may save a named partial DIS (distance) range that corresponds to a distinct part of a common training ride.
Use "Partial Range" pop up tools of data series tables (to apply and mark instantly a saved partial range) in conjunction with CALC tools (choosing CALC range option "Partial range: Marked Lines") for quick analysis and comparison of comparable data sets from different time periods or different persons:
Keyboard Command Focus
on Data Tables
The symbols "S" of invisible SELECTION
pop up tools (located at rightmost position of data table headings) are
now displayed bold (not underlined) when a data
table has the Keyboard Command focus:
• Type [TAB] to move
the Keyboard Command focus on Job Window pages with many data tables or
enterable fields.
• Type [SHI] + [TAB]
to enforce the Keyboard Command focus on the next data table on Job Window
pages with many enterable fields.
• Type [g] or [G]
to open or move on top the related Graph Window of a data table that has
the Keyboard Command focus.
NOTE:
When a Graph Window is on top, type [j] or [J] to move the
related Job Window on top.
Keyboard Commands acting
on Jobs and Windows
The JOBS tool and the GRAPH tool
offer invisible pop up tools and table or button functions to organize
Jobs and windows using the mouse.
REMEMBER:
[F1] shows or hides the JOBS tool.
[SHI] + [F1] minimizes or maximizes the JOBS tool.
[F2] shows or hides the GRAPH tool.
[SHI] +
[F2] minimizes or maximizes the GRAPH tool.
As a complement, you may now use
various Keyboard Commands to organize Jobs and windows:
• Type [ESC]
...to hide the frontmost window.
• Type [CTR] + [TAB] on WIN
...to rotate through all displayed
windows.
• Type [ctrl] + [TAB] on MAC
...to rotate through all displayed
windows.
• Type [F5]
...to hide all Jobs (all Job Windows
and all open Graph Windows).
• Type [F6]
...to show all Job Windows.
• Type [SHI] + [F6]
...to show all Jobs (all Job Windows
and all open Graph Windows).
• Type [F7]
...to invert all Jobs (hide all Jobs
that display at least 1 Window / show all hidden Job Windows).
• Type [SHI] + [F7]
...to invert all Jobs (hide all Jobs
that display at least 1 Window / show all hidden Jobs including the Job
Window and their open Graph Windows).
• Type [F8]
...to quit all Jobs.
• Type [F9]
...to launch a new Job for modification
if a source element is selected in a data table. The table must have the
Keyboard Command focus or the related Graph Window must be on top.
REMEMBER:
• Type [RET]
...to launch
a new Job for consulting if a source element is selected in a data table.
The table must have the Keyboard Command focus or the related Graph Window
must be on top.
General Commands
Some general commands of PowerCoach
have changed or may be executed using new or different options. You should
have a look at the PowerCoach Commands document
to become familiar with modified commands.
Copyright by PowerCoach® Software - 20011020