PowerCoach
and Images
The topics
treated in this document include technical information about the
ways users may create, transform, manage and display the various image
objects of PowerCoach. Visual
communication and imaging are basic concepts of PowerCoach Software.
Visual Communication and Imaging
What
is a Diagram?
What
is a Graph?
What
is a Picture?
"Time
Series" Pictographs and Diagrams
"HRA
vs POW" Pictographs and Diagrams
Graphic
Exploration and Analysis using Diagrams
Graphs
of "Data Series" Jobs
Graphs
of "Person X" Jobs
Using
the GRAPH Tool
Personal
Graph Settings
Sending
Diagrams and Graphs to Album
Adding
Pictures to Album in "Picture" Jobs
Vector and bitmap Image Formats
Conversion
to bitmap Format
Pros
and Cons of Format Conversion
Diagrams and Graphs are dynamic Objects
Tools and Functions to collect Pictures
Tracking
Variation and Trend of Data
Referencing
and documenting Pictures
Designing and managing Picture Projects
Creating
Projects
Saving,
editing and deleting Projects
Converting
Projects to bitmap Format
Viewing
and projecting with "Album" Job
Viewing
and projecting with "Explorer" Job
Scaling
Factors of Printer Software
Creating
Graph Settings for printing
Visual Communication and
Imaging
• PowerCoach communicates and
interacts with users mainly through image objects. These images are
specifically elaborated for cycling and created by powerful tools and functions.
They provide sophisticated graphic exploration and analysis at your fingertips.
ï What characterizes the various images?
ï How to efficiently use features of images?
ï What
should be considered, when printing images?
• The following sections contain answers to such questions and information about the way images are
- created
- acquired
- transformed
- saved
- organized
and displayed on computers or output
on printers with PowerCoach.
• Imaging is dramatically affecting
traditional academic research, teaching and learning. PowerCoach imaging
shapes your mind to reflect on conditions and processes causing results,
rather than focusing only on data and results.
• PowerCoach
integrates smart and intuitive imaging, because one meaningful image
relates more than thousands of words and numbers.
Image Types
• PowerCoach terminology makes
a distinction between Diagram, Graph and Picture type
images.
• Diagrams are images located on window pages of Job Windows.
NOTE: The Job Window is the one window, that gets displayed first when a new Job is launched. Any active Job has always at least one open window, namely the Job Window.
Diagrams are images, representing
graphed data in a standardized way. To respect these standards, possibilities
to modify the aspect of Diagrams are restricted. Some Diagrams, called
Pictographs,
can't be modified at all.
• Graphs are images located and displayed in their own window.
Active Jobs with Graphs may open additional windows, beside the Job Window. Windows of open Graphs are called Graph Windows.
In contrast to Diagrams, users may
modify the aspect of Graphs without restrictions. Graphs are very flexible
objects. It is easy for users to design their own Graph settings, copy
or save such settings and apply instantly copied or saved Graph settings.
Using Graphs, you can optimize for your specific and personal needs the
way graphed data gets displayed.
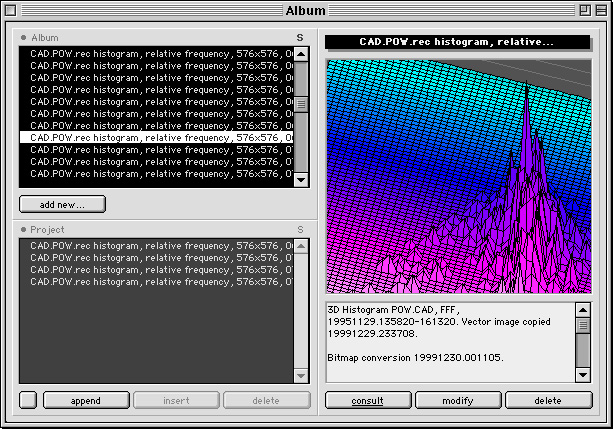
• Pictures are images contained in the Album.
The PowerCoach Album is a sophisticated warehouse for images. It is also a powerful Picture viewer. The Album offers the tools and functions to collect, organize, view or project Pictures efficiently.
Opening a selected Album Picture
launches a corresponding "Picture" Job. On different pages of the Job Window,
"Picture" Jobs display the opened Album Picture with related data and information.
Diagrams
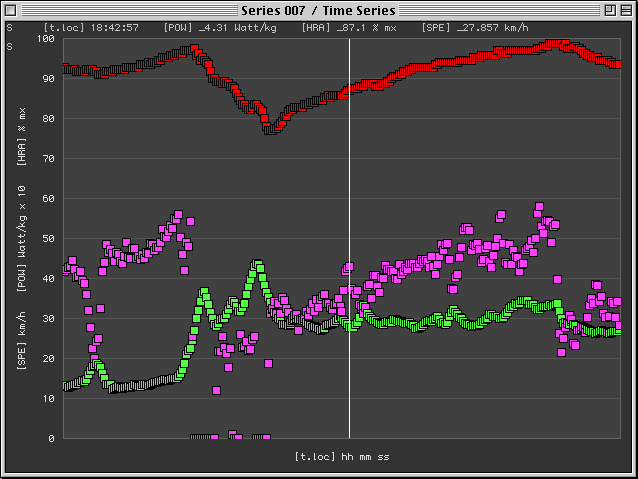
• "Time Series" Pictographs and
Diagrams.
"Time Series" Pictographs show the complete data set of one recorded series (for example of the POW series or the HRA series). They represent the data on a variable time scale, use fixed data values scaling and apply the current smoothing factor of the "Time Series" Diagrams.
"Time Series" Pictographs are displayed
on each page of a "Data Series" Job Window.
"Time Series" Diagrams show the complete data sets of recorded series on a fixed time scale. Fixed data values scaling is used and a standardized smoothing factor, set by the user, is applied. Two types of "Time Series" Diagrams are available:
. Type 1 is located on "Data Series" Job Window page 2 (named "Diagram + Data"). The vertical size of this Diagram depends on the vertical size of the Job Window. Vertical size of this Diagram is therefore variable.
. Type 2 is located on "Data
Series" Job Window page 3 (named "Data + Diagram"). The vertical size of
this Diagram is fixed.
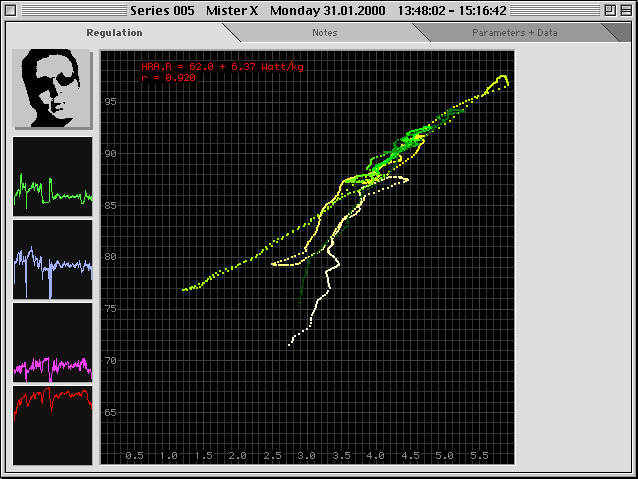
• "HRA vs POW" Pictographs and
Diagrams.
Pictographs and Diagrams, representing
interdependent HRA vs POW relations, are located on "Data Series" Job Window
page 8 (named "Regulation").
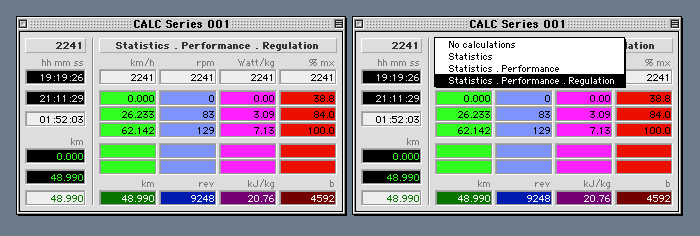
NOTE: "HRA vs POW" Pictographs and Diagrams are available, if CALC mode "Statistics . Performance . Regulation" is executed:
. If a "Data Series" Job is on top, type [F3] to show or hide the CALC tool of this Job. Each "Data Series" Job has a CALC tool.
. Alternatively, execute command "CALC: Show all" of "PowerCoach" main menu, to show the CALC tools of all "Data Series" Jobs.
. Click the invisible pop up chooser on the CALC mode indicator of CALC tools, to select and execute different CALC modes. The following options are available:
- "No
calculations"
- "Statistics"
- "Statistics
. Performance"
- "Statistics
. Performance . Regulation"
. The
CALC mode indicator is located at the top right area of CALC tools.
• Diagrams provide commands and
functions for graphic exploration and analysis. You may call and execute
them using the Diagram area context menu.
NOTE: A context menu offers commands and functions related to a distinct area or object. PowerCoach makes abundant use of context menus. To activate the context menu of an object:
[R*]
...execute a RIGHT CLICK on WIN
...execute a CONTROL CLICK on MAC
anywhere on
the area of the object. You may activate context menus on background windows,
executing their commands and functions, without moving these windows on
top. As long as a part of an object is visible on screen, you may spontaneously
use its context menu.
ï Click the invisible pop
up tool on the "HRA vs POW" Diagram area to access commands and functions
to copy, save and apply your personal "HRA vs POW" Diagram settings.
Graphs
• "Data Series" Jobs have at least one Graph available, namely the
- "Time Series"
Graph. It depends on executed CALC
mode, and on the number of recorded series (for examples SPE series,
CAD series, POW series ...etc), if more or less Graphs become available
in "Data Series" Jobs.
• If CALC mode "Statistics" is executed, a maximum of 5 Statistics related additional Graphs become available:
- "2D Histogram: HRA"
- "2D Histogram: POW"
- "2D Histogram: CAD"
- "2D Histogram: SPE"
- "3D Histogram: POW.CAD"
• If CALC mode "Statistics . Performance" is executed, a maximum of 15 Performance related additional Graphs become available:
- "2D Bars: SPE.mx vs Time
0:01"
- "2D Bars: CAD.mx vs Time
0:01"
- "2D Bars: POW.mx vs Time
0:01"
- "2D Bars: HRA.mx vs Time
0:01"
- "3D Surface: CAD.POW.mx
vs Time 0:01"
- "2D Bars: SPE.mx vs Time
0:16"
- "2D Bars: CAD.mx vs Time
0:16"
- "2D Bars: POW.mx vs Time
0:16"
- "2D Bars: HRA.mx vs Time
0:16"
- "3D Surface: CAD.POW.mx
vs Time 0:16"
- "2D Bars:
SPE.mx vs Time 4:16"
- "2D
Bars: CAD.mx vs Time 4:16"
- "2D
Bars: POW.mx vs Time 4:16"
- "2D
Bars: HRA.mx vs Time 4:16"
- "3D
Surface: CAD.POW.mx vs Time 4:16"
• If all windows are open and unhidden, one active "Data Series" Job might show a maximum of 22 windows:
- 1 Job Window
- 21
Graph Windows
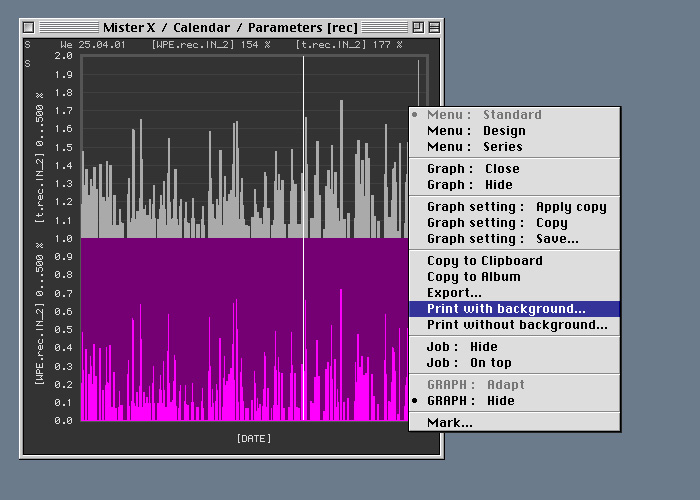
• "Person X" Jobs have 2 Graphs available, if the person has data series imported and saved:
- "Calendar: Data Series"
- "Calendar: Parameters [rec]"
"Person X" Jobs have no Graphs available,
as long as the person has no data series saved.
• If all windows are open and unhidden, one active "Person X" Job might show a maximum of 3 windows:
- 1 Job Window
- 2 Graph
Windows
• Click the invisible pop up chooser
on the Job indicator of the GRAPH tool, to view or select Jobs having
at least one Graph available.
• Click the invisible pop up chooser
on the Graph indicator of the GRAPH tool, to view or select available
Graphs of a selected Job.
• Type [F2] to show or hide the GRAPH tool. Alternatively, execute command "GRAPH: Show" or "GRAPH: Hide" of "PowerCoach" main menu.
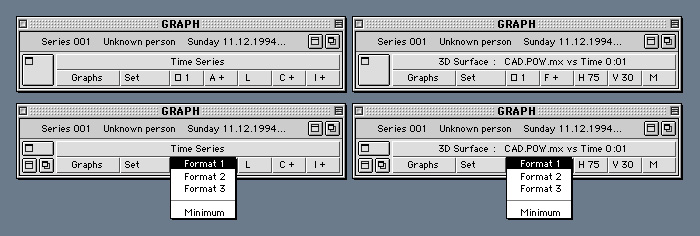
ï The GRAPH tool is used to manage the
- Job Windows
- Graph Windows
- Graph settings
of all active Jobs, having at least one Graph available.

ï Using the GRAPH tool, you may execute the following actions:
1. Select any active Job, that has at least one Graph available, and hide, show or move on top its Job Window.
2. Select, open, close, hide, show or move on top the Graph Window of any available Graph.
3. Design and modify settings, copy settings, save settings and apply copied or saved settings of any available Graph.
ï The GRAPH tool adapts itself dynamically to a Graph in the following cases:
1. The Graph Window is moved on top.
2. The Graph is affected by user action.
3. The data table related to the
Graph is affected by user action.
ï Alternatively, you may show, hide or enforce the adaptation of the GRAPH tool using standard commands of Graph Window context menus:
- "GRAPH: Show"
- "GRAPH: Hide"
- "GRAPH: Adapt"
ï On the GRAPH tool, click invisible pop up choosers on
- Job indicator
- Graph indicator
to select Jobs and Graphs, which
enforces adaptation of the GRAPH tool to any available Graph.
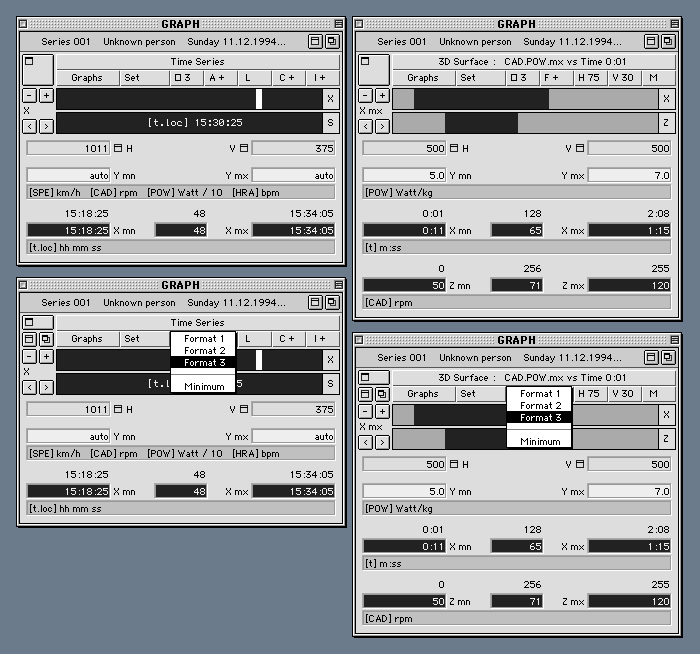
• Working on open Graph Windows, you may design interactively your personal Graph settings. Develop your settings while displaying typical data, specific settings are intended for.
Use Mouse Commands or Keyboard Commands for Graphs, and "play" dynamically with setting parameters and options:
- horizontal
window size
- vertical
window size
- values
units of graphed objects
- minimum
X/Y/Z axis values
- maximum
X/Y/Z axis values
- data display on/off
- title on/off
- labels on/off
- cursor on/off
- horizontal grid lines on/off
- interactive selection on/off
...etc
• Once you are satisfied with the displayed Graph image, save the current Graph setting.
NOTE: Use the context menu of Graph Windows, or click the invisible pop up tool on the "Graphs" area of the GRAPH tool, to access standard commands related to Graph settings, particularly
- "Graph
setting: Apply copy"
- "Graph
setting: Copy"
- "Graph
setting: Save..."
• To apply a saved Graph setting to a Graph, click the invisible pop up tool on the "Graphs" area of the GRAPH tool, and select the named setting.
NOTE:
You may apply Graph settings before opening a Graph Window. If the Graph
Window is already open, the window is resized and a redraw of its content
is executed to comply with the applied setting.
Pictures
• Pictures are images contained
in the Album. To include new Pictures in the Album, or to replace existing
Pictures, several options are available.
• The standard context menu command "Copy to Album" of Diagrams and Graphs sends a copy of the displayed image to the Album.
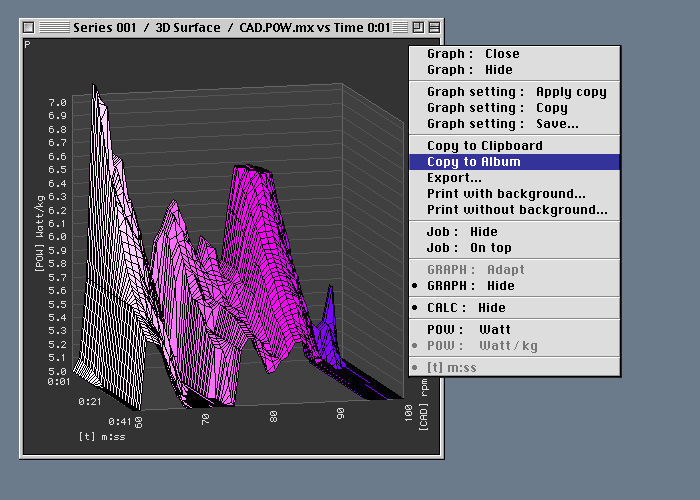
Diagram and Graph images are copied exactly as they show on screen, reflecting current display options. Switch on or off the display option of objects you want to copy or not:
- data display on/off
- title on/off
- labels on/off
- cursor on/off
- horizontal grid lines on/off
...etc
Copied Diagram and Graph images are
saved as Album Pictures using vector
type PICT format.
NOTE: You may switch the current display option of certain Graph objects with a simple click.
. Click title area to switch title on/off.
. Click X axis label area to switch labels on/off,
. Click
Y axis scale area to switch horizontal grid lines on/off.
• The buttons "add new" or "modify" of the Album launch a "Picture" Job. In a "Picture" Job, you may import an image from file using the "Picture" Job menu command
- "Import..."
or you may use the "Edit" menu command
- "Paste"
to paste an image from the Clipboard to the Picture field.
Quit and save the "Picture" Job to add a new Picture to the Album, or have an existing Album Picture replaced.
Images pasted from Clipboard are
converted to the internal PICT format used by PowerCoach. Depending on
the format type of the image contained in the Clipboard, they are saved
as Album Pictures using vector or bitmap type PICT format.
NOTE:
QuickTime must be installed to use "Picture" Job menu command "Import...".
This command should only be used to import PICT format image files. Developer
versions of PowerCoach produce unpredictable results, especially on Mac
OS, if the command is applied to other file types (application may crash).
Vector and bitmap Image
Formats
• The internal image format used
by PowerCoach is PICT. This image format is well supported by high
quality graphic applications and widely used in publishing and print production
environments. An advantage of PICT is its meta format, which permits vector
type object description as well as bitmap type pixel description
of images.
• PowerCoach creates Diagrams and Graphs using always vector type format. Vector format is also maintained while PowerCoach executes the following standard context menu commands of Diagrams and Graphs:
- "Copy to Clipboard"
- "Copy to Album"
- "Export..."
- "Print with background..."
- "Print without background..."
NOTE:
Vector format guarantees maximum image quality on high resolution output
media, like photolithography or color laser printed documents.
• PowerCoach provides functions to convert Album Pictures to bitmap format. Use "Album" Job menu commands
- "Bitmap Picture"
- "Bitmap marked Pictures"
or use "Picture" Job menu command
- "Bitmap"
to convert the image format of Pictures
contained in the Album from vector type to bitmap type.
• Users may want to bitmap Album Pictures, previously copied and saved in vector format. A complex Picture with many elements will probably use
- less computer memory
when it is displayed on screen and
- less file space in PowerCoach_Data
when it gets saved in the Album,
after conversion from vector format to bitmap format.
NOTE:
Copies of complex Diagrams (for example, "HRA vs POW" Diagrams with thousands
of data points of different colors) or complex Graphs (for example, 3D
Graphs with hundreds of X and Z axis elements of different colors) need
a large amount of memory and file space, if vector format is maintained.
Converting such Pictures to bitmap format may reduce considerably required
memory and file space.
ï PowerCoach is checking required
memory and file space of each format while converting Pictures from vector
format to bitmap format. An alert is displayed, if conversion would increase
required memory and file space. At this point, the user may cancel or resume
the conversion.
NOTE:
Bitmap Pictures need a small amount of memory, if the image area is small.
Bitmap Pictures need much memory, if the image area is large. Vector Pictures
need a small amount of memory, as long as they contain only a few elements
(even if the image area is large). Vector Pictures need much memory, if
they contain many elements (independently of image area size).
ï Conversion to bitmap format enforces a fixed number of pixels to the Picture, optimized for display on computer screens. You will see no difference between a bitmap and vector format Picture, as long as you view the Pictures on computers.
This is different when Pictures are printed:
. Pictures in bitmap format print with poor image quality, showing the low pixel resolution of computer screens.
. Pictures in vector format
print with highest possible image quality, dependent on the resolution
of used printers.
NOTE:
If you need to print, and if print quality is an issue, do not convert
Pictures to bitmap format. If you collect Pictures and create Picture Projects
for high quality print output, you should maintain the vector format of
copied Diagrams and Graphs.
ï Conversion to bitmap format
is important to reduce required memory and file space of complex Pictures
being used exclusively for display on computer screens.
NOTE: The aspect of vector format Pictures is slightly different on Windows or Mac OS, due to platform specific fonts. If you prepare Picture Projects for presentations on both platforms, you should
- maintain vector format for all Pictures
or you should
- bitmap all Pictures on one platform
to make sure
that each Picture of a Picture Project will have identical look on both
platforms.
Diagrams and Graphs are
dynamic Objects
• Each Diagram or Graph is a dynamic object:
. If values of a data source are modified, for examples, incorrect HRA values are corrected by the software or through user input, related Diagrams and Graphs are dynamically recalculated and redrawn.
. If the CALC range is modified,
calculations are executed and related Diagrams and Graphs are also dynamically
recalculated and redrawn.
NOTE: Click the invisible pop up chooser on the CALC range indicator of CALC tools, to select and calculate different CALC ranges. The following options are available:
- "Whole
data series"
- "Partial
range: Marked Lines"
- "Partial
range: Time Series Graph"

The CALC range
indicator, located at the top left area of CALC tools, shows the number
of data series table elements included in the current CALC range.
• Most Diagrams and Graphs are interactive objects, for examples:
. If a "Time Series" Diagram on a "Data Series" Job Window is clicked, or when the "Time Series" Graph is clicked (if the "Time Series" Graph Window is open), cursors are displayed at clicked and corresponding Diagram or Graph positions, and the related element of the data series table gets selected on the Job Window.
. If the data series table
on a "Data Series" Job Window is clicked, the clicked element gets selected
and cursors are displayed at corresponding positions of the "Time Series"
Diagram and "Time Series" Graph (if the "Time Series" Graph Window is open).
• 3D Graphs have the capability to be animated objects. You may animate 3D Graphs for extensive data exploring, moving automatically the perspective view of the user:
1. Click the invisible pop up tool on the "M" area of the GRAPH tool adapted to 3D Graph, to start and stop moving perspective view.
2. Select an option of "Animation", to start moving perspective view.
3. Select "Stop", to stop moving
perspective view.
Pictures are static Objects
Album Pictures are static objects. They are not linked to data sources any more:
ï Pictures do not get updated if values of their original data source are modified. No dynamic redraw of copied Diagrams or Graphs will happen in the Album.
ï If the user clicks an Album
Picture, nothing will happen either. Pictures might be image copies of
interactive Diagrams or Graphs, but they are themselves no more interactive
objects.
Tools and Functions to
collect Pictures
• Collecting methodically Picture copies of Diagrams and Graphs in the Album permits efficient tracking of various parameters, for examples:
1. You may instantly oversee the look, variation and trend of parameters during given time periods for one person.
2. You may compare systematically
the look and variation of one parameter with different persons.
NOTE: Do not compare Pictures with other Pictures that have different settings. You must compare Pictures (of the same Diagram or Graph type) created with identical Diagram or Graph settings, including
- horizontal
image size
- vertical
image size
- values
units of graphed objects
- minimum
X/Y/Z axis values
- maximum
X/Y/Z axis values
- smoothing
factor
- data
period
Make sure that you are using relative values units, for examples
- Watt/kg
for POW
- %
mx for HRA
and individualized parameters, for examples
- t.rec.IN
- DIS.rec.IN
- WPE.rec.IN
...etc
when comparing Pictures of data sources originated by different persons.
PowerCoach
offers the tools to design easily specific settings for Diagrams and Graphs
and to save such settings with meaningful names. You may apply instantly
your personal settings to a Diagram or Graph before sending a copy to Album.
• The context menu command "Copy to Album" sends an exact copy of a currently displayed Diagram or Graph to the Album, creating a new Picture named "_New Picture 000000000000000".
The default name of a copied new
Album Picture begins with the underline character and ends with a number,
incremented each time the command is executed.
NOTE:
Because of this default name, "Copy to Album" appends usually new Pictures
to the end of the Album table. If the "Album" Job is on top and the Album
table
has the Keyboard Command focus, simply type [->] to select the
last Picture copied to the Album.
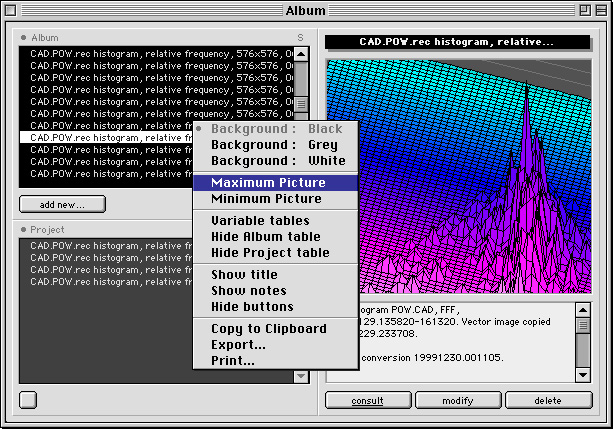
• The "Notes" field of a copied Album Picture contains initially the reference to the original Diagram or Graph, including information about the source data used to create the image:
- type of Diagram or Graph
- person who originated source
data
- time frame represented by
source data
- image format type
- creation time stamp
PowerCoach appends a conversion time
stamp to the "Notes" field if the image
format of an Album Picture gets converted to bitmap type.
NOTE:
Click button "modify" of the Album to launch a "Picture" Job of a selected
Album Picture, which permits editing of the Picture "Name" and "Notes"
fields. Quit and save the "Picture" Job to have the modifications saved
and reflected in the Album.
3D Graph Picture Series
• 3D Graphs may execute automatically "Copy to Album" at each angular position while moving perspective view:
1. Click the invisible pop up tool on the "M" area of the GRAPH tool adapted to 3D Graph, to start and stop moving perspective view.
2. Select an option of "Picture series" (instead of "Animation") when you start moving perspective view, to send automatically Picture copies to Album.
3. Select "Stop" or an option of
"Animation", to stop sending Picture copies to Album.
NOTE:
Sending large Picture series of complex Graphs to the Album might considerably
increase the size of PowerCoach_Data.
Make sure that you have enough free space available on the hard disk volume.
Designing and managing
Picture Projects
• The "Album" Job offers various tools and functions to create and manage sublists of Pictures contained in the Album table.
PowerCoach terminology calls a sublist of Album Pictures, a Picture Project.
• You create, modify and delete Picture Projects in the "Album" Job. Use the buttons
- "append"
- "insert"
- "delete"
to edit, in the Project table, a
sublist of Album Pictures. These buttons are located on the bottom area
of the Project table.
• Buttons for editing Picture
Projects are visible, when Project Editing mode is switched on. To
switch Project Editing mode on and off, click the square button at the
bottom left corner of the Project table area.
NOTE:
At least Album table, Project table and buttons must be visible to access
and use Project Editing mode. Using the context
menu of the Album, select display option "Minimum Picture" to make
all Album objects visible at once.
ï You may save a Picture Project, as it is currently listed in the Project table:
1. Click the invisible pop up tool on the Project table heading.
2. Select "Save list...".
3. On the displayed "Saving the project
list..." dialog window, type the "Category" and "Name" of your Project
in the respective fields.
NOTE:
Alternatively, you may click invisible pop up choosers on "Category" and
"Name" label areas, to select and enter existing categories or names.
• To modify a saved Picture Project:
1. Click the invisible pop up tool on the Project table heading.
2. Select the Picture Project in the hierarchical list.
3. The list of Pictures is loaded and displayed in the Project table.
4. Switch Project
Editing mode on and modify the list.
• To replace a saved Picture Project with the modified version displayed in the Project table:
1. Click the invisible pop up tool on the Project table heading.
2. Select the named Picture Project in the hierarchical list and hold down simultaneously [CTR] key.
3. To save the modified version,
confirm replacement of the precedent version of the Picture Project.
NOTE:
Selecting in pop up tools saved items, holding down simultaneously [CTR]
key, is a standard command in PowerCoach Software to request "replacement"
of the selected item.
• To delete a saved Picture Project:
1. Click the invisible pop up tool on the Project table heading.
2. Select the named Picture Project in the hierarchical list and hold down simultaneously [ALT] key.
3. To definitely delete the named
Picture Project, confirm your request.
NOTE:
Selecting in pop up tools saved items, holding down simultaneously [ALT]
key, is a standard command in PowerCoach Software to request "deletion"
of the selected item.
ï If Picture Projects get
deleted, only their Picture list is affected. No Album Pictures get actually
deleted.
• You may bitmap all Pictures of a Picture Project at once:
1. Make sure that the Picture list of the Project is displayed in the Project table (click the invisible pop up tool on the Project table heading and select the Project in the hierarchical list).
2. Click the invisible pop up tool on the Album table heading and select "Mark project list".
3. Each Picture listed in the Project table gets marked in the Album table.
4. Choose the "Album" Job menu command
"Bitmap marked Pictures".
NOTE:
An alert is displayed, if conversion of a Picture to bitmap format would
increase the required memory and file space. At this point, you may cancel
or resume conversion for this Picture.
• PowerCoach offers different options to view (on computer screens) or project (with beamers) Picture Projects.
You may use the "Album" Job or you
may use the "Explorer" Job to view or project Picture Projects. The "Explorer"
Job features automatic Picture display mode.
• Using the "Album" Job to view or project Picture Projects:

1. Load and display the Picture list of a Project in the Project table (click the invisible pop up tool on the Project table heading and select the Project in the hierarchical list).
2. Make sure that you are not in Project Editing mode. To switch Project Editing mode on and off, click the square button at the bottom left corner of the Project table area.
3. Make sure that the Project table has the Keyboard Command focus (type [TAB] until symbol "S" of the invisible SELECTION pop up tool at rightmost position of the Project table heading shows bold).
4. Once the Project table has the focus, use the standard Keyboard Commands to navigate in the Project list. You may use Arrow keys together with Multipliers, for examples
[<-] displays first Picture
[->] displays last Picture
[UP] + [MULT] displays previous Picture
[DO] + [MULT] displays next Picture
5. Optionally, use the marking keys
[ENT]
or [F12] to mark and unmark Pictures. If [LOC] is activated,
only the marked Pictures get displayed.
NOTE: Use the context menu of the Album and select display option "Maximum Picture". Executing this command hides all Album objects, except the Picture area. Even if the Project table is invisible, you may continue to use the Keyboard Commands to navigate in the Project list.
If the Project table is invisible, execute [CTR] + [*] anywhere on the Picture area to activate the invisible pop up tool to select and load new Projects.
Type [CTR]
+ [Y] to hide other active Jobs (or maximize the "Album" Job Window)
to get a "clean" Picture display on the screen.
• Using the "Explorer" Job to view or project Picture Projects:
1. Launch the "Explorer" Job. If the "Explorer" Job is already active and displayed on top, go to "Explorer" Job Window page 1 (named "PowerCoach").
2. Click the invisible pop up tool on the Picture area.
3. Select and load a project from the hierarchical list of available Picture Projects.
4. Select an appropriate timing value to display automatically the Pictures of the Project.
5. Type [RET] to start and stop automatic Picture display mode.
6. If automatic Picture display mode is stopped, use the standard Keyboard Commands to navigate in the Project list. You may use Arrow keys together with Multipliers, for examples
[<-] displays first Picture
[->] displays last Picture
[UP] + [MULT] displays previous Picture
[DO] + [MULT] displays next Picture
7. Optionally, use the marking keys
[ENT]
or [F12] to mark and unmark Pictures. If [LOC] is activated,
only the marked Pictures get displayed.
NOTE:
Type
[CTR] + [Y] to hide other active Jobs (or maximize the "Explorer"
Job Window) to get a "clean" Picture display on the screen.
Printing Images
• Printing images is easy and flexible with PowerCoach. At any time, any displayed image object may be printed, as it shows on screen, using a command of its context menu.
ï Context menus of Diagrams and Graphs offer two print commands:
- "Print..."
- "Print without background..."
ï Context menus of Pictures offer one print command:
- "Print..."
NOTE: The option "Print without background..." prints an image exactly as it shows on screen, with two exceptions:
1. Background areas are not printed. They remain "transparent" or white (when printing on white paper).
2. Text or labels of light colors, used on screen on dark color background areas, are printed using dark color.
Choosing "Print
without background..." reduces considerably ink or toner consumption when
printing with ink-jet or laser printers.
• Images are printed exactly as they show on screen, reflecting the actual size of the image area and all current display options. Switch on or off the display option of objects you want to print or not:
- data display on/off
- title on/off
- labels on/off
- cursor on/off
- horizontal grid lines on/off
...etc
NOTE: You may switch the current display option of certain Graph objects with a simple click.
. Click title area to switch title on/off.
. Click X axis label area to switch labels on/off,
. Click
Y axis scale area to switch horizontal grid lines on/off.
• If a printed Diagram does not
fit on one page (like "Time Series" Diagrams of many hours of data
recording), you should apply scaling provided by the printer driver software,
to reduce the size of the printed Diagram accordingly.
NOTE:
The horizontal image size of a "Time Series" Diagram corresponds to the
time scale length of the whole data series. This might include parts of
the Diagram "invisible" on screen without horizontal scrolling.
ï You may also use scaling
of the printer driver software to enlarge printed Diagrams and Graphs.
The image is enlarged, but does still fit on one page, for example, when
printing "HRA vs POW" Diagrams with scaling factor 125 %.
ï More objects and information are displayed on Graphs, for examples more
- X axis labels
- horizontal grid lines
- displayed series data values
...etc
if larger Graph Windows are used.
You may systematically use this feature and apply corresponding scaling
factors, to fit Graphs on one printer page.
NOTE: Design your specific Graph settings for printing, and save these settings with meaningful names, for examples:
- "Power
Test, Print Portrait 125 %"
- "Aerobic
/ Anaerobic, Print Landscape 100 %"
- "Periodization
365 Days, Print Portrait 50 %"
Once you have created your personal Graph settings for printing, proceed as follows to print a Graph:
1. Apply the Graph setting (using the GRAPH tool).
2. Open the Graph Window (if not open).
3. Request "Print with background..." or "Print without background..." (using the Graph Window context menu).
4. Set paper orientation (on the Print Setup dialog).
5. Set scaling factor (on the Print Setup dialog)
6. Print
Copyright by PowerCoach® Software - 20011020