PowerCoach
et Images
Les thèmes
traités dans ce document contiennent des informations techniques
sur la manière dont les utilisateurs peuvent créer, transformer,
gérer et présenter les différents objets images de
PowerCoach. La communication
visuelle et la représentation par images sont des concepts fondamentaux
du logiciel PowerCoach.
Communication visuelle et représentation par images
Qu'est-ce
qu'un Diagramme?
Qu'est-ce
qu'un Graphe?
Qu'est-ce
qu'un Diapo?
Pictographes
et Diagrammes "Série temporelle"
Pictographes
et Diagrammes "HRA vs POW"
Exploration
et analyse graphique au moyen de Diagrammes
Graphes
des Jobs "Séries de données"
Graphes
des Jobs "Personne X"
Se
servir de l'outil GRAPH
Réglages
personnels de Graphe
Envoyer
des Diagrammes et Graphes dans l'Album
Ajouter
des images à l'Album dans un Job "Image"
Formats d'image vectoriel et bitmap
Conversion
en format bitmap
Pros
and Cons of Format Conversion
Diagrams and Graphs are dynamic Objects
Tools and Functions to collect Pictures
Tracking
Variation and Trend of Data
Referencing
and documenting Pictures
Designing and managing Picture Projects
Creating
Projects
Saving,
editing and deleting Projects
Converting
Projects to bitmap Format
Viewing
and projecting with "Album" Job
Viewing
and projecting with "Explorer" Job
Scaling
Factors of Printer Software
Creating
Graph Settings for printing
Communication visuelle
et représentation par images
• PowerCoach communique et interagit
avec ses utilisateurs principalement au moyen d'objets images. Ces
images sont spécialement conçues pour le cyclisme et créées
par de puissants outils et fonctions. Ils mettent entre vos mains des fonctionnalités
sophistiquées pour des explorations et analyses graphiques.
• Qu'est-ce qui caractérise les différentes images?
• Comment utiliser efficacement les spécificités des images?
• Que
faut-il considérer lors de l'impression des images?
• Les chapitres suivant contiennent des réponses à de telles questions et des informations sur la manière dont les images sont
- créées
- acquises
- transformées
- sauvegardées
- organisées
et affichées
sur l'ordinateur ou imprimées par PowerCoach.
• La représentation
par l'image bouleverse profondément la recherche académique
traditionnelle, l'enseignement et l'apprentissage. Le concept imagé
de PowerCoach forme votre esprit à une réflexion sur les
conditions et processus amenant aux résultats plutôt que le
focalise sur des données et des résultats.
• PowerCoach
intègre une représentation par l'image raffinée et
intuitive car une seule image parlante apporte davantage que des milliers
de mots et de nombres.
Types d'images
• La terminologie de PowerCoach
fait une distinction entre les types d'images Diagramme, Graphe
et Diapo.
• Les Diagrammes sont des images qui se trouvent sur des pages de fenêtres Job.
NOTE: La fenêtre Job est celle qui apparaît à l'affichage en premier lorsqu'un nouveau Job est lancé. Un Job en activité, quel qu'il soit, a toujours au moins une fenêtre ouverte, à savoir la fenêtre Job.
Les Diagrammes sont des images représentant
des données dans un système graphique standardisé.
Afin de respecter ces standards, les possibilités de modifications
de l'aspect des Diagrammes sont limitées. Certains Diagrammes appelés
Pictographes
ne peuvent pas du tout être modifiés.
• Les Graphes sont des images qui se situent et s‚affichent dans leur propre fenêtre.
A côté de la fenêtre Job, des Jobs actifs avec Graphes peuvent ouvrir des fenêtres supplémentaires. Les fenêtres ouvertes des Graphes sont appelées fenêtres Graphes.
Par opposition au Diagrammes, les
utilisateurs peuvent modifier l‚aspect des Graphes sans restrictions. Les
Graphes sont des objets extrêmement flexibles. Il est facile pour
l‚utilisateur de définir ses propres réglages de Graphe,
de copier ou enregistrer de tels réglages et d‚appliquer instantanément
des réglages copiés ou enregistrés. En utilisant des
Graphes, vous pouvez optimiser, pour vos besoins spécifiques et
personnels, la manière dont les données s'affichent graphiquement.
• Les Diapos sont des images contenues dans l‚Album.
L‚Album de PowerCoach est un entrepôt sophistiqué pour images. C‚est aussi un outil puissant pour visionner des images. L‚Album offre les outils et les fonctions pour collectionner, organiser, visualiser et projeter de manière efficace des Diapos.
Par l‚ouverture d‚une Diapo sélectionnée
dans l‚Album, on lance un Job "Image" qui lui correspond. Sur différentes
pages de la fenêtre Job, les Jobs "Image" affichent la Diapo ouverte
de l‚Album avec des données et informations s'y rattachant.
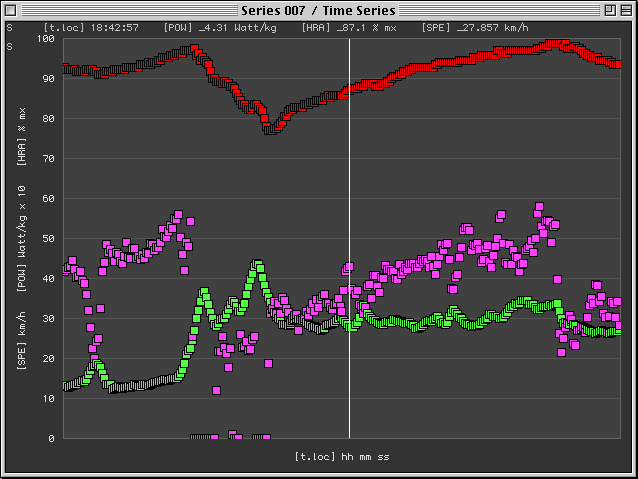
Diagrammes
• Pictographes et Diagrammes "Série
temporelle".
Les Pictographes "Série temporelle" montrent l'ensemble des données d'une série enregistrée (par exemple de la série POW ou de la série HRA). Ils représentent les données sur une échelle variable du temps, utilisent des échelles fixes pour les valeurs de données et appliquent le facteur de lissage courant des Diagrammes "Série temporelle".
Les Pictographes "Série temporelle"
s‚affichent sur chaque page d‚une fenêtre Job "Série de données".
Les Diagrammes "Série temporelle" montrent l'ensemble des données des séries enregistrées sur une échelle fixe du temps. Des échelles fixes pour les valeurs de données sont utilisées et un facteur standardisé de lissage, choisi par l‚utilisateur, est appliqué. Deux types de Diagrammes "Série temporelle" sont disponibles:
. Type 1 se trouve sur la page 2 (intitulée "Diagramme + Données") de la fenêtre Job "Série de données". La dimension verticale de ce Diagramme dépend de la dimension verticale de la fenêtre Job. La dimension verticale de ce Diagramme est donc variable.
. Type 2 se trouve sur la page
3 (intitulée "Données + Diagramme") de la fenêtre Job
"Série de données". La dimension verticale de ce Diagramme
est fixe.
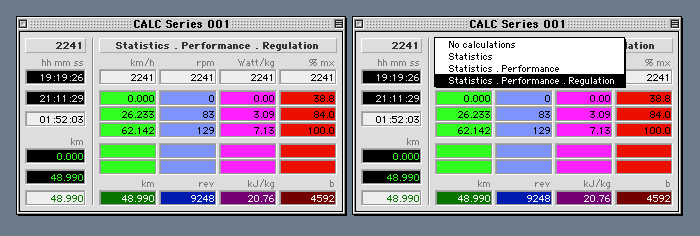
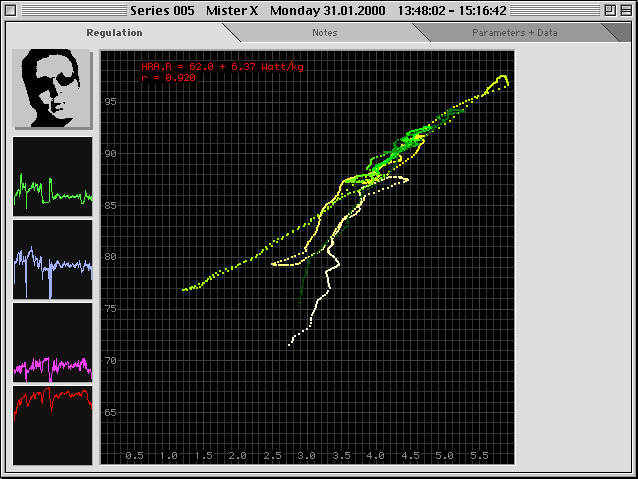
• Pictographes et Diagrammes "HRA
vs POW".
Les Pictographes et Diagrammes représentant
des relations interdépendantes HRA vs POW, se trouvent sur la la
page 8 (intitulée "Regulation") de la fenêtre Job "Série
de données".
NOTE: Les Pictographes et Diagrammes "HRA vs POW" sont disponibles si le mode CALC "Statistiques . Performance . Régulation" est exécuté:
. Si un Job "Série de données" est affiché au premier plan, appuyez sur [F3] pour afficher ou masquer l'outil CALC de ce Job. Chaque Job "Série de données" possède un outil CALC.
. Alternativement, vous pouvez exécuter la commande "CALC: Afficher tous" du menu principal "PowerCoach" pour afficher les outils CALC de tous les Jobs "Série de données".
. Sur les outils CALC, cliquez le sélecteur pop up invisible, se trouvant sur l'indicateur du mode CALC, pour choisir et exécuter les différents modes CALC. Les options suivantes sont disponibles:
- "Pas
de calculs"
- "Statistiques"
- "Statistiques
. Performance"
- "Statistiques
. Performance . Régulation"
. L'indicateur
du mode CALC se trouve dans la partie supérieure droite des outils
CALC.
• Les Diagrammes mettent à
disposition des commandes et fonctions pour des explorations et analyses
graphiques. Vous pouvez les appeler et les appliquer au moyen du menu
contextuel du Diagramme.
NOTE: Un menu contextuel offre des commandes et fonctions en relation avec un sujet ou un objet distinct. PowerCoach utilise abondamment des menus contextuels. Pour activer le menu contextuel d'un objet:
[R*]
...exécutez CLIC DROITE sur WIN
...exécutez CONTROL-CLIC sur MAC
n'importe où
sur la surface de l'objet. Vous pouvez activer des menus contextuels sur
des fenêtres à l'arrière-plan et utiliser leurs commandes
et fonctions, sans déplacer les fenêtres au premier plan.
Tant qu'une partie d'un objet est visible sur l'écran, vous pouvez
vous servir spontanément de son menu contextuel.
• Cliquez l'outil pop up invisible
sur la surface du Diagramme "HRA vs POW" pour accéder à des
commandes et fonctions pour copier, enregistrer et appliquer vos réglages
personnels de Diagramme "HRA vs POW".
Graphes
• Les Jobs "Série de données" ont, au moins, un Graphe disponible, à savoir le Graphe
- "Série temporelle"
Plus ou moins de Graphes deviennent
disponibles dans les Jobs "Série de Données" en fonction
du mode CALC exécuté
et du nombre de séries enregistrées (par exemple la série
SPE, la série CAD, la série POW ...etc).
• Si le mode CALC "Statistiques" est exécuté, un maximum de 5 Graphes se rapportant aux statistiques devient disponible en plus:
- "Histogramme 2D: HRA"
- "Histogramme 2D: POW"
- "Histogramme 2D: CAD"
- "Histogramme 2D: SPE"
- "Histogramme 2D: POW.CAD"
• Si le mode CALC "Statistiques . Performance" est exécuté, un maximum de 15 Graphes se rapportant à la performance est disponible en plus:
- "Barres 2D: SPE.mx vs Temps
0:01"
- "Barres 2D: CAD.mx vs Temps
0:01"
- "Barres 2D: POW.mx vs Temps
0:01"
- "Barres 2D: HRA.mx vs Temps
0:01"
- "Surface 3D: CAD.POW.mx
vs Temps 0:01"
- "Barres 2D: SPE.mx vs Temps
0:16"
- "Barres 2D: CAD.mx vs Temps
0:16"
- "Barres 2D: POW.mx vs Temps
0:16"
- "Barres 2D: HRA.mx vs Temps
0:16"
- "Surface 3D: CAD.POW.mx
vs Temps 0:16"
- "Barres 2D: SPE.mx vs Temps
4:16"
- "Barres 2D: CAD.mx vs Temps
4:16"
- "Barres 2D: POW.mx vs Temps
4:16"
- "Barres 2D: HRA.mx vs Temps
4:16"
- "Surface 3D: CAD.POW.mx
vs Temps 4:16"
• Si toutes les fenêtres sont ouvertes et non masquées, un Job "Série de Données" actif peut afficher un maximum de 22 fenêtres:
- 1 fenêtre Job
- 21 fenêtres Graphe
• Les Jobs "Personne X" ont 2 Graphes disponibles, si la personne possède des séries de données importées et sauvegardées:
- "Calendrier: Séries
de données"
- "Calendrier: Paramètres
[rec]"
Les Jobs "Personne X" n'ont pas de
Graphes disponibles tant que la personne ne possède pas de séries
de données sauvegardées.
• Si toutes les fenêtres sont ouvertes et non masquées, un Job "Personne X" actif peut afficher un maximum de 3 fenêtres:
- 1 fenêtre Job
- 2 fenêtres Graphe
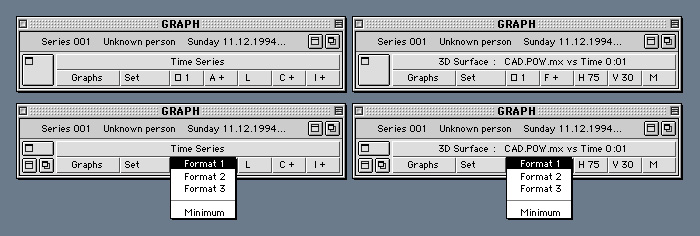
• Sur l'outil GRAPH, cliquez le
sélecteur pop up invisible sur l'indicateur du Job pour voir
ou sélectionner les Jobs ayant au moins un Graphe disponible.
• Sur l'outil GRAPH, cliquez le
sélecteur pop up invisible sur l'indicateur du Graphe, pour
voir ou sélectionner les Graphes disponibles d'un Job sélectionné.
• Appuyez sur [F2] pour afficher ou masquer l'outil GRAPH. Alternativement, vous pouvez exécuter la commande "GRAPH: Afficher" ou "GRAPH: Masquer" du menu principal "PowerCoach".
• L'outil GRAPH est utilisé pour gérer les
- fenêtres Job
- fenêtres Graphe
- réglages Graphe
de tous les Jobs actifs, ayant au moins un Graphe disponible.

• Avec l'outil GRAPH, vous pouvez exécuter les actions suivantes:
1. Sélectionner un quelconque Job actif qui a au moins un Graphe disponible et, masquer, afficher ou déplacer au premier plan sa fenêtre Job.
2. Sélectionner, ouvrir, fermer, masquer, afficher ou déplacer au premier plan la fenêtre Graphe d'un quelconque Graphe disponible.
3. Créer et modifier des réglages, copier des réglages, sauvegarder des réglages et appliquer des réglages copiés ou sauvegardés d'un quelconque Graphe disponible.
• L'outil GRAPH s'adapte automatiquement à un Graphe dans les cas suivants:
1. La fenêtre Graphe est déplacée au premier plan.
2. Le Graphe est touché par une action de l'utilisateur.
3. La table des données liée
au Graphe est touchée par une action de l'utilisateur.
• Alternativement, vous pouvez afficher, masquer ou forcer l'adaptation de l'outil GRAPH au moyen des commandes standard du menu contextuel des fenêtres Graphe:
- "GRAPH: Afficher"
- "GRAPH: Masquer"
- "GRAPH: Adapter"
• Sur l'outil GRAPH, cliquez les sélecteurs pop up invisibles sur
- l'indicateur du Job
- l'indicateur du Graphe
pour sélectionner des Jobs
et Graphes, ce qui force l'outil GRAPH à s'adapter à un quelconque
Graphe disponible.
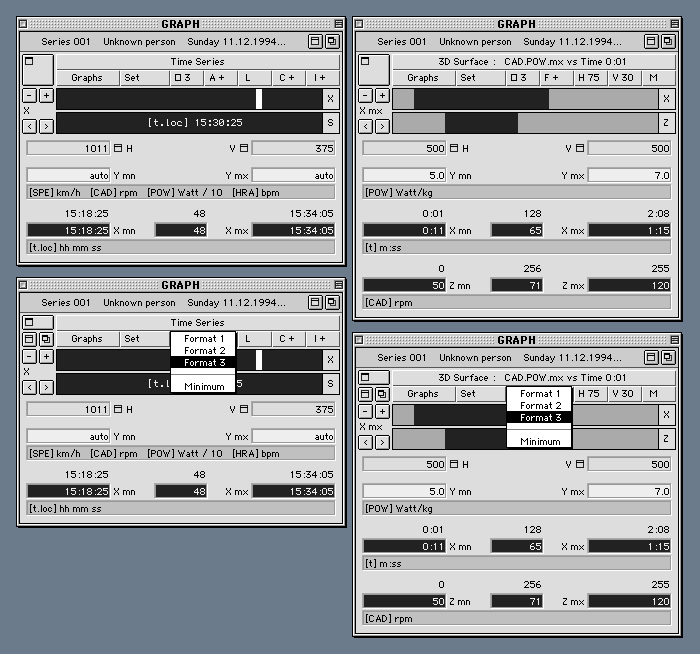
• Des réglages personnels de Graphe peuvent être crées de manière interactive, en travaillant sur des fenêtres Graphe ouvertes. Développez vos réglages en affichant des données typiques auxquelles ces réglages spécifiques seront destinés.
Servez-vous des Commandes Souris ou des Commandes Clavier pour Graphes et "jouez" de manière dynamique avec les paramètres et options de réglage:
- dimension horizontale de
fenêtre
- dimension verticale de fenêtre
- unités des valeurs
représentées
- valeurs minimum des axes
X/Y/Z
- valeurs maximum des axes
X/Y/Z
- affichage des valeurs activé/désactivé
- titre activé/désactivé
- libellés activé/désactivé
- curseur activé/désactivé
- lignes horizontales activé/désactivé
- sélection interactive
activé/désactivé
...etc
• Une fois que vous êtes satisfait de l'image que montre le Graphe, enregistrez le réglage en cours.
NOTE: Utilisez le menu contextuel des fenêtres Graphe ou cliquez l'outil pop up invisible sur la surface "Graphs" de l'outil GRAPH, pour accéder à des commandes standard relatives aux réglages de Graphe, notamment
- "Réglage
du Graphe: Appliquer la copie"
- "Réglage
du Graphe: Copier"
- "Réglage
du Graphe: Enregistrer..."
• Pour appliquer un réglage de Graphe enregistré, cliquez l'outil pop up invisible sur la surface "Graphs" de l'outil GRAPH et sélectionnez le réglage en question.
NOTE:
Vous pouvez appliquer des réglages de Graphe avant d'ouvrir une
fenêtre Graphe. Si la fenêtre Graphe est déjà
ouverte, la fenêtre est redimensionnée et un redessinnement
de son contenu est exécuté pour se conformer au réglage
appliqué.
Diapos
• Les Diapos sont des images contenues
dans l'Album. Pour insérer de nouvelles Diapos dans l'Album,
ou remplacer des Diapos existantes, plusieurs options sont disponibles.
• La commande standard "Copier dans l'Album" du menu contextuel des Diagrammes et Graphes envoie dans l'Album une copie de l'image affichée.
Les images Diagramme et Graphe sont copiées exactement comme elles apparaissent à l'écran, reflétant les options d'affichage en cours. Activez ou non les options d'affichage que vous voulez copier ou ne pas copier:
- affichage des valeurs activé/désactivé
- titre activé/désactivé
- libellés activé/désactivé
- curseur activé/désactivé
- lignes horizontales activé/désactivé
...etc
Les images copiées Diagramme
et Graphe sont enregistrées en Diapos d'Album sous le format
PICT de type vectoriel.
NOTE: Vous pouvez activer ou désactiver l'option d'affichage de certains objets Graphe par simple clic.
. Cliquez la surface du titre pour activer/désactiver le titre.
. Cliquez la surface des libellés de l'axe X pour activer/désactiver les libellés.
. Cliquez
la surface de l'échelle de l'axe Y pour activer/désactiver
les lignes horizontales.
• Les boutons "ajouter..." ou "modifier" de l'Album lancent un Job "Image". Dans un Job "Image", vous pouvez importer une image, à partir d'un fichier, au moyen de la commande
- "Importer..."
du menu Job "Image" ou coller des images du Presse-papiers dans le champ image, en utilisant la commande
- "Paste"
du menu "Edit".
Quittez et enregistrez le Job "Image" pour ajouter une nouvelle Diapo à l'Album ou pour remplacer une Diapo d'Album existante.
Les images collées à
partir du Presse-papiers sont converties au format interne PICT utilisé
par PowerCoach. En fonction du type de format des images contenues dans
le Presse-papiers, elles seront enregistrées en Diapos d'Album sous
le format PICT de type vectoriel ou bitmap.
NOTE:
QuickTime doit être installé pour utiliser la commande "Importer..."
du menu Job "Image". Cette commande ne doit être utilisée
pour importer, à partir de fichiers, que des images de format PICT.
Les versions de développement de PowerCoach produisent des résultats
imprévisibles, en particulier sur Mac OS, si cette commande est
appliquée à d'autres types de fichier (l'application peut
se bloquer).
Formats d'image vectoriel
et bitmap
• Le format d'image interne utilisé
par PowerCoach est PICT. Ce format d'image est bien supporté
par des applications graphiques de haute qualité et est largement
utilisé dans les domaines de la publication et de l'imprimerie.
Un avantage de PICT est son metaformat qui permet la description d'images
par
objet de type vectoriel aussi bien que la description par pixel
de type bitmap.
• PowerCoach crée des Diagrammes et Graphes en utilisant toujours le format de type vectoriel. Le format vectoriel est aussi maintenu lorsque PowerCoach exécute les commandes standard suivantes du menu contextuel des Diagrammes et Graphes:
- "Copier dans Presse-papiers"
- "Copier dans l'Album"
- "Exporter..."
- "Imprimer avec arrière-plan..."
- "Imprimer sans arrière-plan..."
NOTE:
Le format vectoriel garantit une qualité d'image maximale en utilisant
des médias à haute résolution, comme en photolithographie
ou pour des documents imprimés en couleurs par imprimantes laser.
• PowerCoach fournit des fonctions pour convertir les Diapos d'Album dans le format bitmap. Utilisez, du menu Job "Album", les commandes
- "Bitmap l'image"
- "Bitmap les images marquées"
ou utilisez, du menu Job "Image", la commande
- "Bitmap"
pour convertir le format d'image
des Diapos contenu dans l'Album, de type vectoriel en type bitmap.
• Des utilisateurs peuvent avoir besoin de transformer en bitmap, des Diapos préalablement copiées et enregistrées en format vectoriel. Une image complexe avec beaucoup d'éléments utilisera probablement
- moins de mémoire vive
quand elle sera affichée à l'écran et
- moins de place dans PowerCoach_Data
quand elle sera sauvegardée
dans l'Album, après conversion du format vectoriel en format bitmap.
NOTE:
Copies of complex Diagrams (for example, "HRA vs POW" Diagrams with thousands
of data points of different colors) or complex Graphs (for example, 3D
Graphs with hundreds of X and Z axis elements of different colors) need
a large amount of memory and file space, if vector format is maintained.
Converting such Pictures to bitmap format may reduce considerably required
memory and file space.
• PowerCoach is checking required
memory and file space of each format while converting Pictures from vector
format to bitmap format. An alert is displayed, if conversion would increase
required memory and file space. At this point, the user may cancel or resume
the conversion.
NOTE:
Bitmap Pictures need a small amount of memory, if the image area is small.
Bitmap Pictures need much memory, if the image area is large. Vector Pictures
need a small amount of memory, as long as they contain only a few elements
(even if the image area is large). Vector Pictures need much memory, if
they contain many elements (independently of image area size).
• Conversion to bitmap format enforces a fixed number of pixels to the Picture, optimized for display on computer screens. You will see no difference between a bitmap and vector format Picture, as long as you view the Pictures on computers.
This is different when Pictures are printed:
. Pictures in bitmap format print with poor image quality, showing the low pixel resolution of computer screens.
. Pictures in vector format
print with highest possible image quality, dependent on the resolution
of used printers.
NOTE:
If you need to print, and if print quality is an issue, do not convert
Pictures to bitmap format. If you collect Pictures and create Picture Projects
for high quality print output, you should maintain the vector format of
copied Diagrams and Graphs.
• Conversion to bitmap format
is important to reduce required memory and file space of complex Pictures
being used exclusively for display on computer screens.
NOTE: The aspect of vector format Pictures is slightly different on Windows or Mac OS, due to platform specific fonts. If you prepare Picture Projects for presentations on both platforms, you should
- maintain vector format for all Pictures
or you should
- bitmap all Pictures on one platform
to make sure
that each Picture of a Picture Project will have identical look on both
platforms.
Diagrams and Graphs are
dynamic Objects
• Each Diagram or Graph is a dynamic object:
. If values of a data source are modified, for examples, incorrect HRA values are corrected by the software or through user input, related Diagrams and Graphs are dynamically recalculated and redrawn.
. If the CALC range is modified,
calculations are executed and related Diagrams and Graphs are also dynamically
recalculated and redrawn.
NOTE: Click the invisible pop up chooser on the CALC range indicator of CALC tools, to select and calculate different CALC ranges. The following options are available:
- "Whole
data series"
- "Partial
range: Marked Lines"
- "Partial
range: Time Series Graph"

The CALC range
indicator, located at the top left area of CALC tools, shows the number
of data series table elements included in the current CALC range.
• Most Diagrams and Graphs are interactive objects, for examples:
. If a "Time Series" Diagram on a "Data Series" Job Window is clicked, or when the "Time Series" Graph is clicked (if the "Time Series" Graph Window is open), cursors are displayed at clicked and corresponding Diagram or Graph positions, and the related element of the data series table gets selected on the Job Window.
. If the data series table
on a "Data Series" Job Window is clicked, the clicked element gets selected
and cursors are displayed at corresponding positions of the "Time Series"
Diagram and "Time Series" Graph (if the "Time Series" Graph Window is open).
• 3D Graphs have the capability to be animated objects. You may animate 3D Graphs for extensive data exploring, moving automatically the perspective view of the user:
1. Click the invisible pop up tool on the "M" area of the GRAPH tool adapted to 3D Graph, to start and stop moving perspective view.
2. Select an option of "Animation", to start moving perspective view.
3. Select "Stop", to stop moving
perspective view.
Pictures are static Objects
Album Pictures are static objects. They are not linked to data sources any more:
• Pictures do not get updated if values of their original data source are modified. No dynamic redraw of copied Diagrams or Graphs will happen in the Album.
• If the user clicks an Album
Picture, nothing will happen either. Pictures might be image copies of
interactive Diagrams or Graphs, but they are themselves no more interactive
objects.
Tools and Functions to
collect Pictures
• Collecting methodically Picture copies of Diagrams and Graphs in the Album permits efficient tracking of various parameters, for examples:
1. You may instantly oversee the look, variation and trend of parameters during given time periods for one person.
2. You may compare systematically
the look and variation of one parameter with different persons.
NOTE: Do not compare Pictures with other Pictures that have different settings. You must compare Pictures (of the same Diagram or Graph type) created with identical Diagram or Graph settings, including
- horizontal
image size
- vertical
image size
- values
units of graphed objects
- minimum
X/Y/Z axis values
- maximum
X/Y/Z axis values
- smoothing
factor
- data
period
Make sure that you are using relative values units, for examples
- Watt/kg
for POW
- %
mx for HRA
and individualized parameters, for examples
- t.rec.IN
- DIS.rec.IN
- WPE.rec.IN
...etc
when comparing Pictures of data sources originated by different persons.
PowerCoach
offers the tools to design easily specific settings for Diagrams and Graphs
and to save such settings with meaningful names. You may apply instantly
your personal settings to a Diagram or Graph before sending a copy to Album.
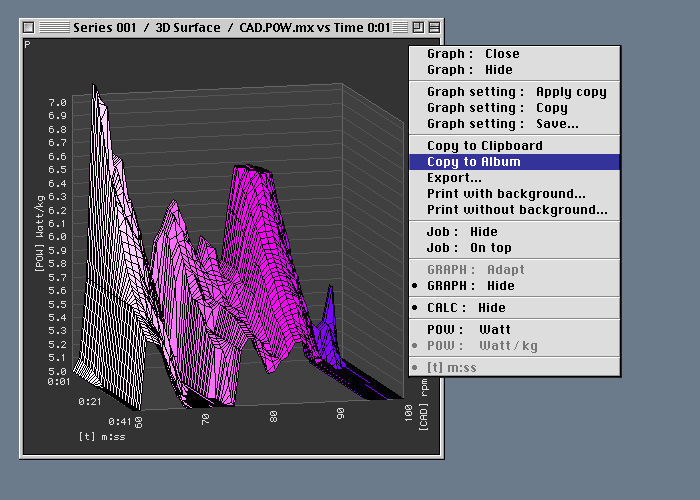
• The context menu command "Copy to Album" sends an exact copy of a currently displayed Diagram or Graph to the Album, creating a new Picture named "_New Picture 000000000000000".
The default name of a copied new
Album Picture begins with the underline character and ends with a number,
incremented each time the command is executed.
NOTE:
Because of this default name, "Copy to Album" appends usually new Pictures
to the end of the Album table. If the "Album" Job is on top and the Album
table
has the Keyboard Command focus, simply type [->] to select the
last Picture copied to the Album.
• The "Notes" field of a copied Album Picture contains initially the reference to the original Diagram or Graph, including information about the source data used to create the image:
- type of Diagram or Graph
- person who originated source
data
- time frame represented by
source data
- image format type
- creation time stamp
PowerCoach appends a conversion time
stamp to the "Notes" field if the image
format of an Album Picture gets converted to bitmap type.
NOTE:
Click button "modify" of the Album to launch a "Picture" Job of a selected
Album Picture, which permits editing of the Picture "Name" and "Notes"
fields. Quit and save the "Picture" Job to have the modifications saved
and reflected in the Album.
3D Graph Picture Series
• 3D Graphs may execute automatically "Copy to Album" at each angular position while moving perspective view:
1. Click the invisible pop up tool on the "M" area of the GRAPH tool adapted to 3D Graph, to start and stop moving perspective view.
2. Select an option of "Picture series" (instead of "Animation") when you start moving perspective view, to send automatically Picture copies to Album.
3. Select "Stop" or an option of
"Animation", to stop sending Picture copies to Album.
NOTE:
Sending large Picture series of complex Graphs to the Album might considerably
increase the size of PowerCoach_Data.
Make sure that you have enough free space available on the hard disk volume.
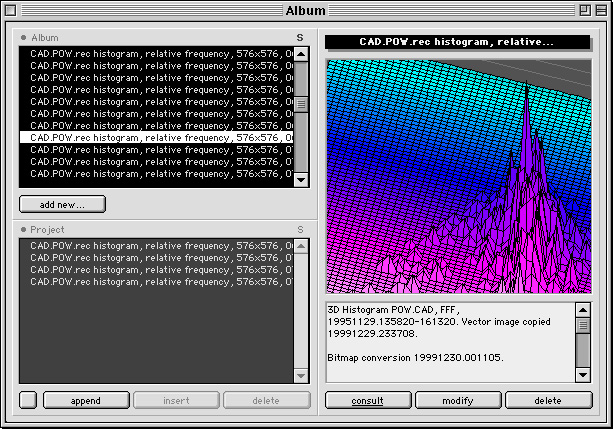
Designing and managing
Picture Projects
• The "Album" Job offers various tools and functions to create and manage sublists of Pictures contained in the Album table.
PowerCoach terminology calls a sublist of Album Pictures, a Picture Project.
• You create, modify and delete Picture Projects in the "Album" Job. Use the buttons
- "append"
- "insert"
- "delete"
to edit, in the Project table, a
sublist of Album Pictures. These buttons are located on the bottom area
of the Project table.
• Buttons for editing Picture
Projects are visible, when Project Editing mode is switched on. To
switch Project Editing mode on and off, click the square button at the
bottom left corner of the Project table area.
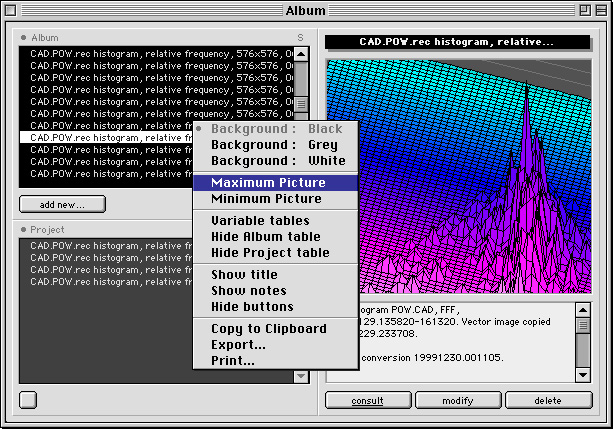
NOTE:
At least Album table, Project table and buttons must be visible to access
and use Project Editing mode. Using the context
menu of the Album, select display option "Minimum Picture" to make
all Album objects visible at once.
• You may save a Picture Project, as it is currently listed in the Project table:
1. Click the invisible pop up tool on the Project table heading.
2. Select "Save list...".
3. On the displayed "Saving the project
list..." dialog window, type the "Category" and "Name" of your Project
in the respective fields.
NOTE:
Alternatively, you may click invisible pop up choosers on "Category" and
"Name" label areas, to select and enter existing categories or names.
• To modify a saved Picture Project:
1. Click the invisible pop up tool on the Project table heading.
2. Select the Picture Project in the hierarchical list.
3. The list of Pictures is loaded and displayed in the Project table.
4. Switch Project
Editing mode on and modify the list.
• To replace a saved Picture Project with the modified version displayed in the Project table:
1. Click the invisible pop up tool on the Project table heading.
2. Select the named Picture Project in the hierarchical list and hold down simultaneously [CTR] key.
3. To save the modified version,
confirm replacement of the precedent version of the Picture Project.
NOTE:
Selecting in pop up tools saved items, holding down simultaneously [CTR]
key, is a standard command in PowerCoach Software to request "replacement"
of the selected item.
• To delete a saved Picture Project:
1. Click the invisible pop up tool on the Project table heading.
2. Select the named Picture Project in the hierarchical list and hold down simultaneously [ALT] key.
3. To definitely delete the named
Picture Project, confirm your request.
NOTE:
Selecting in pop up tools saved items, holding down simultaneously [ALT]
key, is a standard command in PowerCoach Software to request "deletion"
of the selected item.
• If Picture Projects get
deleted, only their Picture list is affected. No Album Pictures get actually
deleted.
• You may bitmap all Pictures of a Picture Project at once:
1. Make sure that the Picture list of the Project is displayed in the Project table (click the invisible pop up tool on the Project table heading and select the Project in the hierarchical list).
2. Click the invisible pop up tool on the Album table heading and select "Mark project list".
3. Each Picture listed in the Project table gets marked in the Album table.
4. Choose the "Album" Job menu command
"Bitmap marked Pictures".
NOTE:
An alert is displayed, if conversion of a Picture to bitmap format would
increase the required memory and file space. At this point, you may cancel
or resume conversion for this Picture.
• PowerCoach offers different options to view (on computer screens) or project (with beamers) Picture Projects.
You may use the "Album" Job or you
may use the "Explorer" Job to view or project Picture Projects. The "Explorer"
Job features automatic Picture display mode.
• Using the "Album" Job to view or project Picture Projects:

1. Load and display the Picture list of a Project in the Project table (click the invisible pop up tool on the Project table heading and select the Project in the hierarchical list).
2. Make sure that you are not in Project Editing mode. To switch Project Editing mode on and off, click the square button at the bottom left corner of the Project table area.
3. Make sure that the Project table has the Keyboard Command focus (type [TAB] until symbol "S" of the invisible SELECTION pop up tool at rightmost position of the Project table heading shows bold).
4. Once the Project table has the focus, use the standard Keyboard Commands to navigate in the Project list. You may use Arrow keys together with Multipliers, for examples
[<-] displays first Picture
[->] displays last Picture
[UP] + [MULT] displays previous Picture
[DO] + [MULT] displays next Picture
5. Optionally, use the marking keys
[ENT]
or [F12] to mark and unmark Pictures. If [LOC] is activated,
only the marked Pictures get displayed.
NOTE: Use the context menu of the Album and select display option "Maximum Picture". Executing this command hides all Album objects, except the Picture area. Even if the Project table is invisible, you may continue to use the Keyboard Commands to navigate in the Project list.
If the Project table is invisible, execute [CTR] + [*] anywhere on the Picture area to activate the invisible pop up tool to select and load new Projects.
Type [CTR]
+ [Y] to hide other active Jobs (or maximize the "Album" Job Window)
to get a "clean" Picture display on the screen.
• Using the "Explorer" Job to view or project Picture Projects:
1. Launch the "Explorer" Job. If the "Explorer" Job is already active and displayed on top, go to "Explorer" Job Window page 1 (named "PowerCoach").
2. Click the invisible pop up tool on the Picture area.
3. Select and load a project from the hierarchical list of available Picture Projects.
4. Select an appropriate timing value to display automatically the Pictures of the Project.
5. Type [RET] to start and stop automatic Picture display mode.
6. If automatic Picture display mode is stopped, use the standard Keyboard Commands to navigate in the Project list. You may use Arrow keys together with Multipliers, for examples
[<-] displays first Picture
[->] displays last Picture
[UP] + [MULT] displays previous Picture
[DO] + [MULT] displays next Picture
7. Optionally, use the marking keys
[ENT]
or [F12] to mark and unmark Pictures. If [LOC] is activated,
only the marked Pictures get displayed.
NOTE:
Type
[CTR] + [Y] to hide other active Jobs (or maximize the "Explorer"
Job Window) to get a "clean" Picture display on the screen.
Printing Images
• Printing images is easy and flexible with PowerCoach. At any time, any displayed image object may be printed, as it shows on screen, using a command of its context menu.
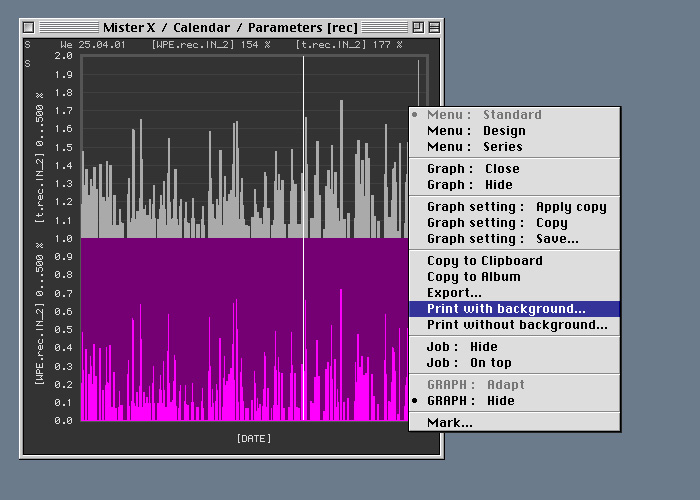
• Context menus of Diagrams and Graphs offer two print commands:
- "Print..."
- "Print without background..."
• Context menus of Pictures offer one print command:
- "Print..."
NOTE: The option "Print without background..." prints an image exactly as it shows on screen, with two exceptions:
1. Background areas are not printed. They remain "transparent" or white (when printing on white paper).
2. Text or labels of light colors, used on screen on dark color background areas, are printed using dark color.
Choosing "Print
without background..." reduces considerably ink or toner consumption when
printing with ink-jet or laser printers.
• Images are printed exactly as they show on screen, reflecting the actual size of the image area and all current display options. Switch on or off the display option of objects you want to print or not:
- data display on/off
- title on/off
- labels on/off
- cursor on/off
- horizontal grid lines on/off
...etc
NOTE: You may switch the current display option of certain Graph objects with a simple click.
. Click title area to switch title on/off.
. Click X axis label area to switch labels on/off,
. Click
Y axis scale area to switch horizontal grid lines on/off.
• If a printed Diagram does not
fit on one page (like "Time Series" Diagrams of many hours of data
recording), you should apply scaling provided by the printer driver software,
to reduce the size of the printed Diagram accordingly.
NOTE:
The horizontal image size of a "Time Series" Diagram corresponds to the
time scale length of the whole data series. This might include parts of
the Diagram "invisible" on screen without horizontal scrolling.
• You may also use scaling
of the printer driver software to enlarge printed Diagrams and Graphs.
The image is enlarged, but does still fit on one page, for example, when
printing "HRA vs POW" Diagrams with scaling factor 125 %.
• More objects and information are displayed on Graphs, for examples more
- X axis labels
- horizontal grid lines
- displayed series data values
...etc
if larger Graph Windows are used.
You may systematically use this feature and apply corresponding scaling
factors, to fit Graphs on one printer page.
NOTE: Design your specific Graph settings for printing, and save these settings with meaningful names, for examples:
- "Power
Test, Print Portrait 125 %"
- "Aerobic
/ Anaerobic, Print Landscape 100 %"
- "Periodization
365 Days, Print Portrait 50 %"
Once you have created your personal Graph settings for printing, proceed as follows to print a Graph:
1. Apply the Graph setting (using the GRAPH tool).
2. Open the Graph Window (if not open).
3. Request "Print with background..." or "Print without background..." (using the Graph Window context menu).
4. Set paper orientation (on the Print Setup dialog).
5. Set scaling factor (on the Print Setup dialog)
6. Print
Copyright by PowerCoach® Software - 20011020